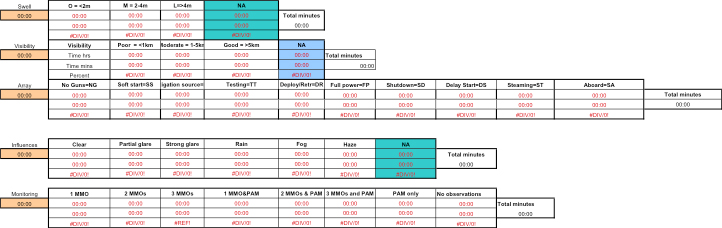
This sheet is populated automatically, so no data are entered or altered manually. There is a useful table at the bottom of the sheet that shows total times for swell, visibility, array status, influences, and monitoring. The pink cells on the left hand side should all be equal. If they are not, there is an error. These values are used to create graphs.